

 Varad
Varad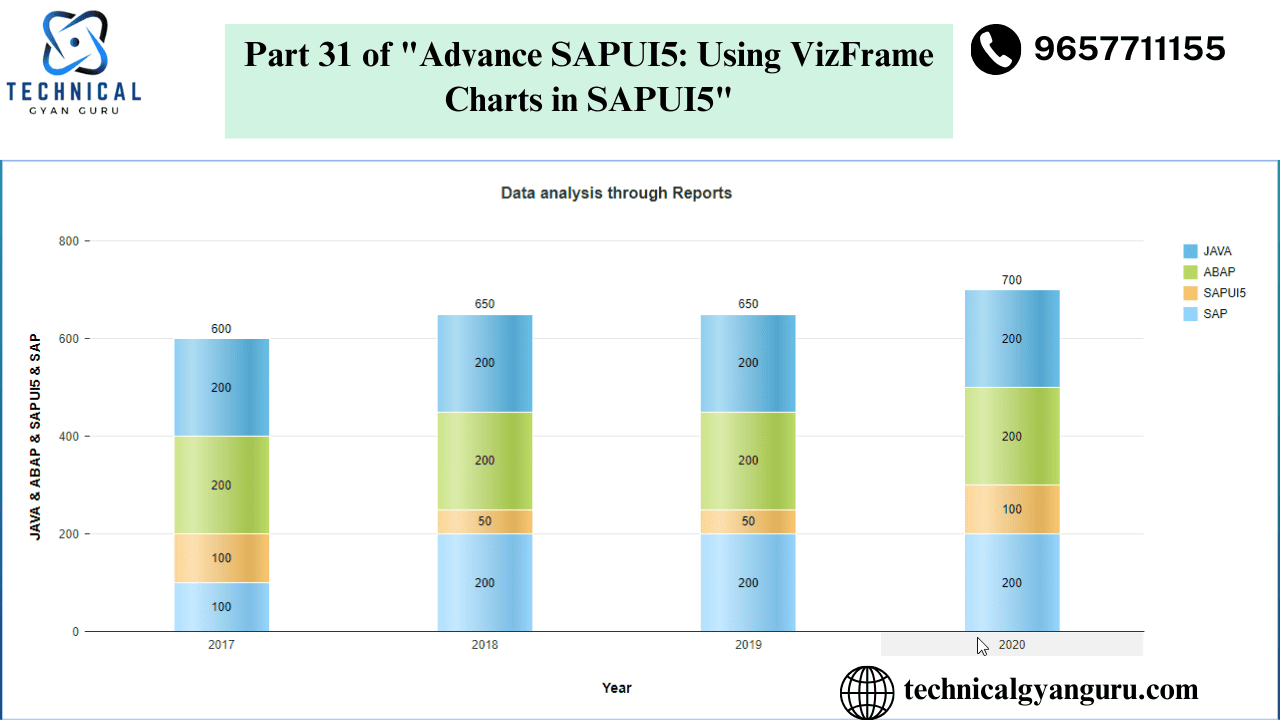
The ability to display data graphically is another feature offered by SAPUI5. Charts such as column, bar, pie, and line charts, among others, can be used to do this.
We shall examine column charts in this course. We will use a column chart to show the employee count data from different companies. We will learn which UI controls to utilize and which libraries are necessary for charting applications.
Now let’s get started.
1) Use the SAPUI5 Application template to start a new UI5 project.
Select File->New->Project from template in your Web IDE. Enter the required information in the wizard that appears, then click Finish.

As a result, a new UI5 project will be generated and appear as seen below in the Web IDE’s project explorer pane.

I’ve given the project the name columnchartdemo.
2) Produce the Data Set that will be seen in the Chart.
Right-click on the model folder to generate a new JSON file. Give it the name chartdata. Now generate some JSON-formatted data, like I have done below for the number of employees across different firms.

JSON code is given below
{
	"Companies": [{
		"CompanyName": "IBM",
		"EmployeeCount": "500000"
	}, {
		"CompanyName": "Accenture",
		"EmployeeCount": "300000"
	}, {
		"CompanyName": "Infosys",
		"EmployeeCount": "600000"
	}, {
		"CompanyName": "Deloitte",
		"EmployeeCount": "700000"
	}, {
		"CompanyName": "KPMG",
		"EmployeeCount": "800000"
	}]
}
To validate the JSON data you create, you can utilize the JSONLint web tool. Errors occur when we create JSON data and then forget where the square, curly, or comma braces should be placed. This prevents the consuming application from parsing the data at runtime. Below is a screenshot of JSONLint.

Build a JSON model using a JSON data set.
Navigate to the manifest.json file located within the webapp folder. A manifest.json file has two editors: the code editor and the descriptor editor. To create new Models for the application, I like to use the description editor. You can observe that the application creation wizard has already constructed the i18n model in the descriptor editor. Let’s now construct a JSON model. After selecting the plus icon, type the model’s name and description. The type in this instance will be a JSON model.


I typed chartmodel as the model’s name, chose JSON as the type, and then hit OK. On the page below, fill in the URI area. The JSON file we generated earlier in this lesson has a relative location called URI.

4) The code of the view
We must include the VizFrame UI control in the display. where the view’s namespace section (highlighted in yellow) must mention the sap.viz.ui5.controls library. Two aggregations are included in the VizFrame control: dataset and feeds. Two further libraries are needed for these aggregations: sap.viz.ui5.data for the dataset aggregation and sap.viz.ui5.controls.common.feeds for the feeds aggregation.

There are several different types of data set classes available in the sap.viz.ui5.data namespace, including FlattenedDataSet, CustomDataSet, and DataSet. For this case, we’ve utilized FlattenedDataSet. Measures and dimensions, two additional aggregations in the FlattenedDataSet, are really utilized to bind the data that will be displayed on the graph. The parameter that will be shown on the horizontal axis, also known as the category axis, is termed the dimension. Measure, commonly known as the value axis, is the value of the model data that will be shown on the graph’s vertical axis.
5) Code of the controller
The model is taken from the Component and placed on the vizframe control in the controller. Additionally, we set the VizFrame UI control’s vizProperties. View the code in the controller’s onInit() method below.
onInit: function () {

			var oVizFrame = this.getView().byId("vizframe");
			var oModel = this.getOwnerComponent().getModel();
			oVizFrame.setModel(oModel);
			oVizFrame.setVizProperties({
				plotArea: {
					colorPalette: d3.scale.category20().range()
				}
			});
		}
6) Carry out the application.
Select the “play” button located on your Web IDE’s toolbar. In a new browser tab, the program will open as a result. It should be evident to you that the required column chart is on the screen.

The output will appear in a bar format as indicated below if you, for example, alter the viztype attribute in the xml view code from column to bar.

VizFrame supported chart kinds are displayed below in the SAP API reference document.

I think this article gave you a good understanding of this fascinating subject. Please leave a remark below if you have any questions, concerns, or recommendations for us. I will be pleased to reply to you.
YOU MAY BE INTERESTED IN
10 Real-World SAP ABAP Programming Examples (with Code!)
Your Definitive Guide to Becoming a SAP ABAP Developer