

Master ABAP debugging with ADT. Learn to set breakpoints, inspect variables, step through code, and fix errors efficiently. Enhance your troubleshooting skills.
In today’s fast-paced software development environment, efficient debugging is crucial for ensuring robust and error-free applications. For developers working withABAP (Advanced Business Application Programming), the ABAP Development Tools (ADT) in Eclipse provides a powerful and modern environment for debugging. This article delves into the intricacies of debugging in ADT, offering professional insights and best practices to help you leverage this tool to its fullest potential
Understanding ADT
The ABAP Development Tools (ADT) is an Eclipse-based integrated development environment (IDE) designed for ABAP programming. ADT offers a modern development experience with a range of features including code editing, testing, and debugging. It provides a unified platform for developers to create, modify, and debug ABAP code efficiently.
Setting Up ADT for Debugging
Before you can start debugging, ensure that your ADT is properly set up:
- Install Eclipse: Download and install the latest version of Eclipse IDE for Java Developers.
- Install ADT: Within Eclipse, go to
Help>Eclipse Marketplaceand search for “ABAP Development Tools” to install. - Configure Connection: Set up your connection to the SAP system using the SAP Logon credentials.
Starting a Debug Session
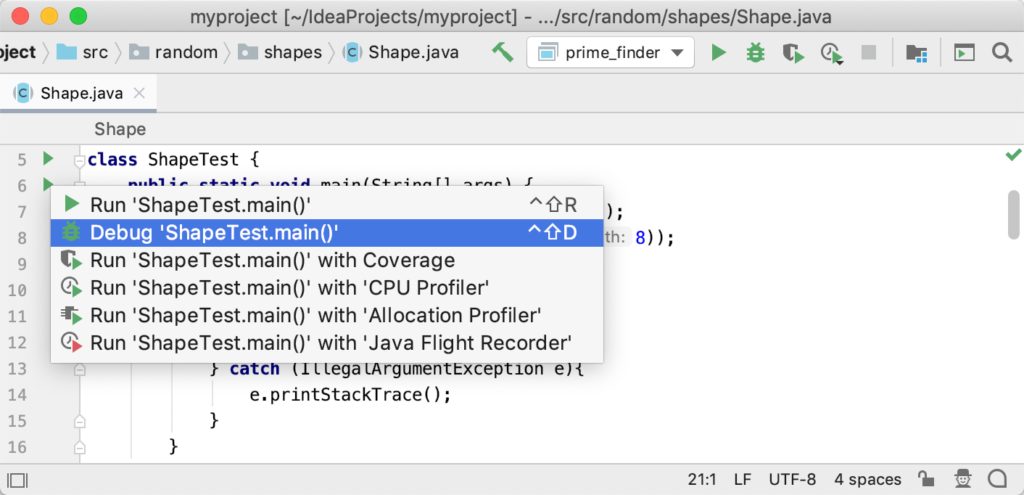
Run Press Shift F9.
Run press Alt + Shift+ F9
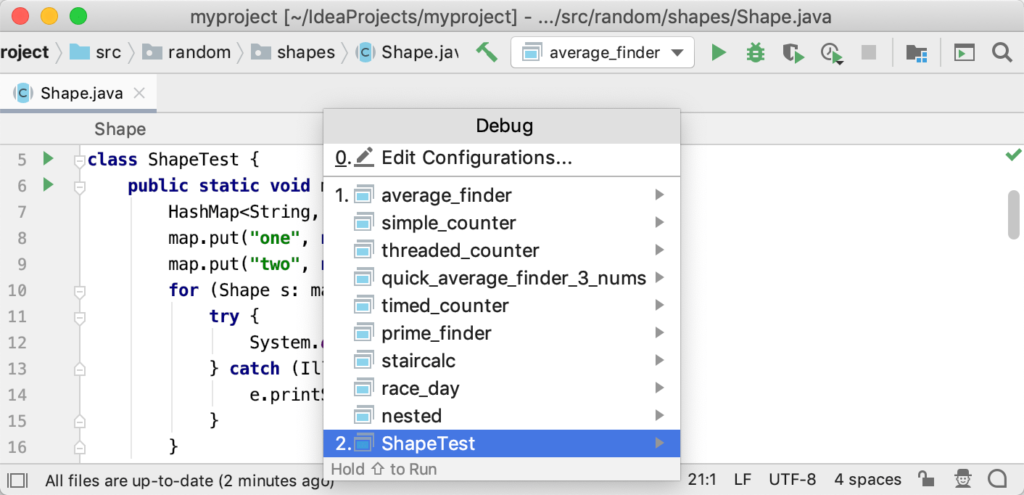
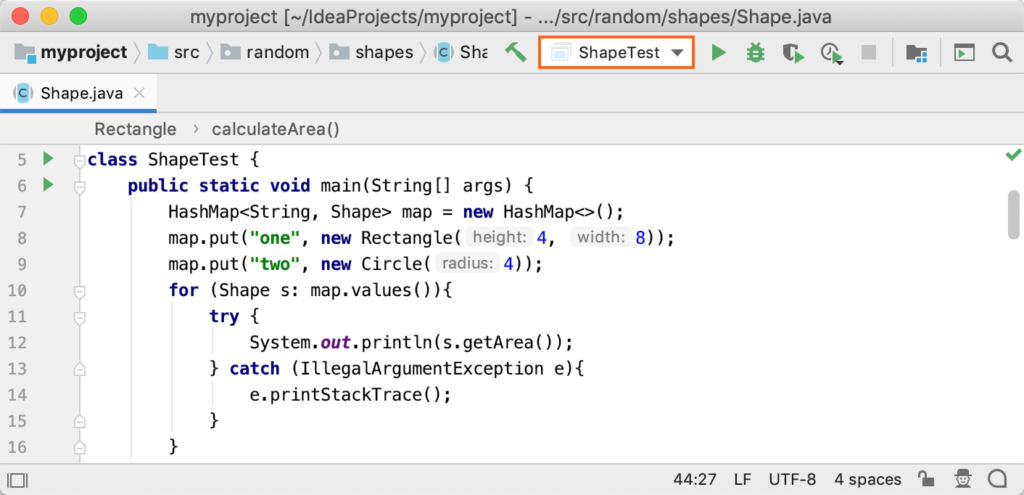
To initiate a debug session in ADT:
- Open the Program: Navigate to the ABAP program you wish to debug.
- Set Breakpoints: Click in the left margin next to the line number where you want to set a breakpoint.
- Run in Debug Mode: Right-click the program and select
Debug As>ABAP Application.
Breakpoints and Watchpoints
Breakpoints and watchpoints are essential tools for debugging:
- Breakpoints: Stop the execution of the program at specific lines to examine the state.
- Watchpoints: Halt execution when the value of a variable changes.
Setting Breakpoints:
- Click on the left margin next to the line number.
- Use the
Breakpointsview to manage and configure breakpoints.
Setting Watchpoints:
- In the
Variablesview, right-click the variable and selectAdd Watchpoint.
Exploring Debug Perspectives
ADT offers several perspectives to aid in debugging:
- Debug Perspective: Provides views for Breakpoints, Variables, and the Call Stack.
- ABAP Perspective: Standard perspective for ABAP development with debugging capabilities.
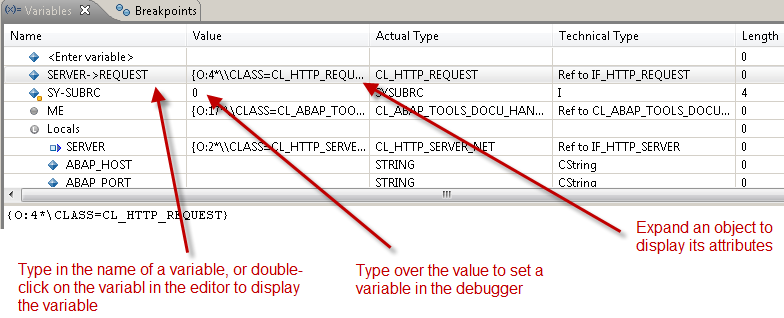
Variable Inspection and Manipulation
During a debug session, you can inspect and modify variable values:
- Variables View: Displays the current values of variables in scope.
- Expressions View: Allows you to add and evaluate custom expressions.
Modifying Variables:
- Right-click a variable in the
Variablesview and selectChange Value.
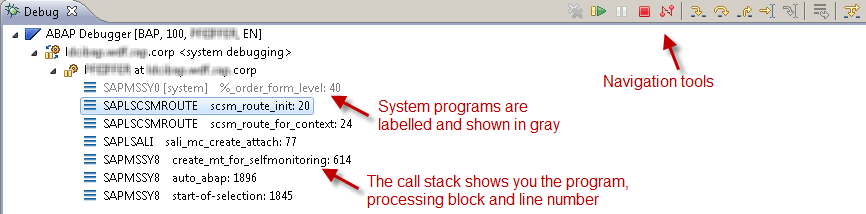
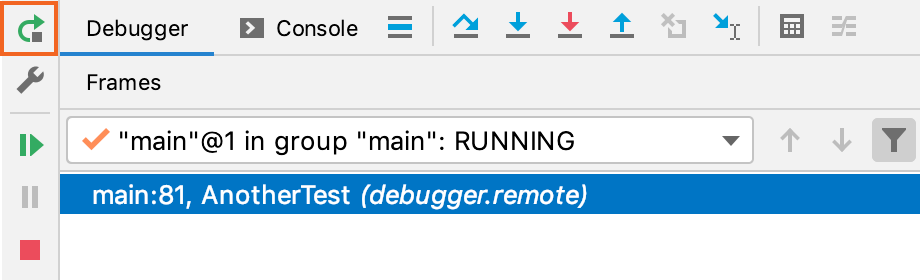
Call Stack Analysis
The call stack provides a snapshot of the active function calls:
- Call Stack View: Shows the sequence of function calls that led to the current point of execution.
- Navigating the Stack: Click on a stack frame to view the code and variable state at that point.
Advanced Debugging Techniques
Enhance your debugging with advanced techniques:
- Conditional Breakpoints: Set breakpoints that trigger only when specific conditions are met.
- Step Filters: Skip certain methods or classes during step execution to focus on relevant code.
- Memory Analysis: Use memory analysis tools to detect and diagnose memory leaks and performance issues.
Best Practices for Effective Debugging
Follow these best practices to debug efficiently:
- Isolate the Issue: Narrow down the problem by testing smaller code sections.
- Reproduce the Problem: Ensure the issue can be consistently reproduced.
- Log Information: Use logging to gather additional context.
- Document Findings: Keep detailed notes on issues and their resolutions for future reference.
Troubleshooting Common Issues
Address common debugging challenges:
- Connection Issues: Ensure stable network and correct system configuration.
- Breakpoint Ignored: Verify breakpoint conditions and code execution path.
- Performance Lag: Optimize debug configurations and limit active breakpoints.
Conclusion
Debugging in ADT is a powerful capability that enhances the ABAP development process. By mastering the tools and techniques available in ADT, you can efficiently identify and resolve issues, leading to more robust and reliable software. With the insights and practices shared in this guide, you are well-equipped to navigate and conquer debugging challenges in your ABAP projects.
you may be interested in this blog here:-
Top SAP Modules in Demand 2024 Insights & Trends
Advanced OOP Concepts in SAP ABAP A Comprehensive Guide
GRC Security: Ensuring Comprehensive Governance, Risk, and Compliance
Why Use SAP SuccessFactors: A Game-Changer for HR and Business Growth