
We are all familiar with creating Odata Services and calling them from the frontend till reading this post. Frontend, or more accurately, SAPUI5, is a technology that lets you bring your ideas to life.
Indeed, who said SAP couldn’t offer creative and dynamic user interfaces? With today’s cutting-edge technologies, anything is possible.
Introducing SAP’s Micro charts and—spoiler alert—binding them dynamically using OData.
Therefore, we will move forward with my manager, Durgesh Teli,’s demand and creative design in order to provide MICROCHARTS a better look. The requirements are as follows:
We are developing a File System Dashboard, wherein we will show the File Path of every server on our system with available disk space below a user-specified threshold.
tcode: ST06 allows you to view the File System Analysis on the system.

Fair enough: Now, I need to show the servers whose File system’s disk space is less than the customized value that I have stored in my Z table :

All right, so I need to display the servers whose disk space for file systems is less than the personalized amount I have in my Z table:
- Server Name
- File Path
- Free Space


Since the logic of FM is straightforward and can be self-programmed by any intelligent ABAPer, it is not released. Recall that Mickey is our main focus!
Excellent! We can now create the Odata Service since the FM has been created:
The steps are as follows, and let’s review them once:
1) Where is Tcode SEGW located?The back-end structure:

2) The entity and entity set that will house the data must be created: Since the Function Module has already been constructed, we will import the RFC structure:


We made the necessary attribute selections, supplied the key, and completed the entity set preparation.

Our Entity and EntitySet have now been successfully created:

The Runtime Artifacts are created by saving and generating:
Rewrite the FILESYSSET_GET_ENTITYSET function in the DPC_EXT class:
Logic: To obtain the file details and the defined client avail space, we will use the Function module in this method and export it to et_entityset.

Now, create the Odata Service in frontend server and check the service : Great! it is working.

Next, establish the Odata Service on the front-end server and verify its functionality: Fantastic! It’s functioning.
Moving on to the UI5 side:
We start by making a new SAP UI5 application called File_Sys_Dash and begin creating the view.
The View’s High Points:
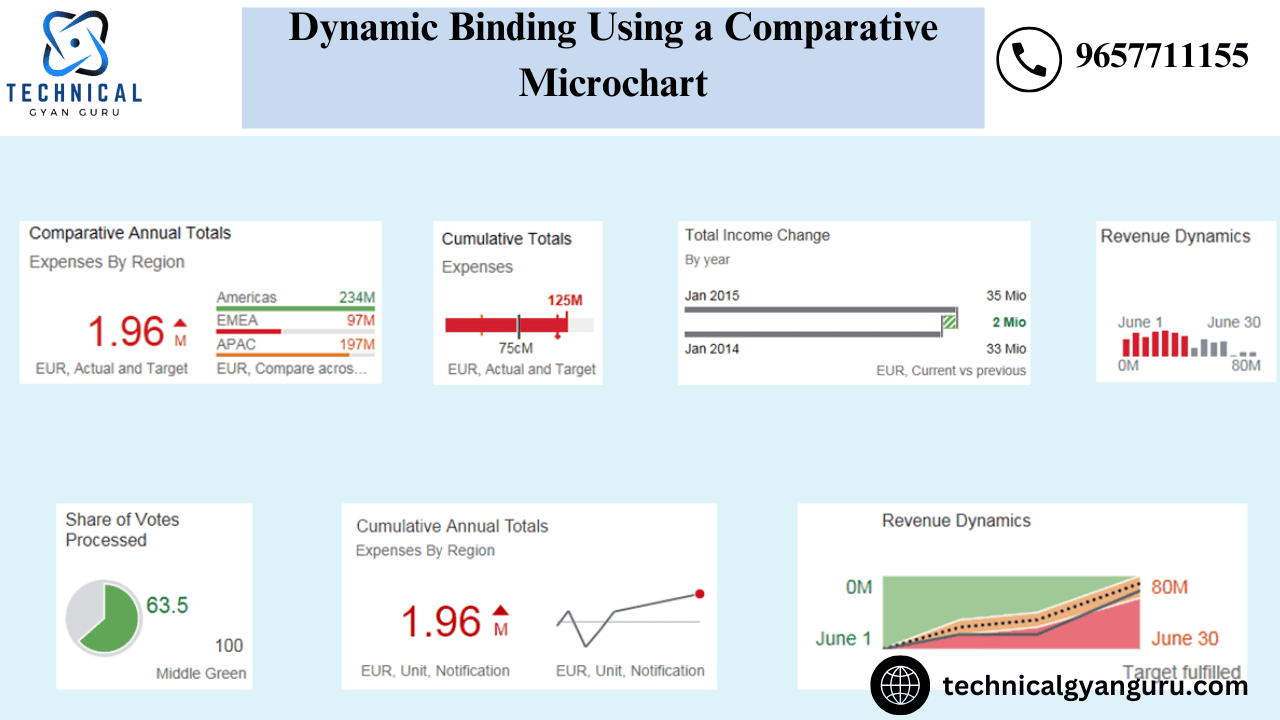
A Generic Tile—basically, a tile that resembles the Standard Dashboard Tiles offered on the Fiori Launchpad—will be included in this view. Prior to my lead’s insistence that we could also put some dynamic user interactive data on the Tile, I was under the impression that Tiles only contained static data that could be placed over them. It was then that we learned about ComparisonMicrocharts. Additionally, graphs can be displayed on tiles.
Thus, we will employ ComparisonMicroCharts in these tiles to show the File systems with less space than the specified available space.
We must link our application to the produced Odata before building the View.
Let’s now code our fundamental creative imagination in the View:

As can be seen above, the Comparison Micro chart’s data only consists of the rows that we actually need to display because we will be binding it dynamically.
Manager:
We will call our Odata’s GetEntitySet Method in the controller’s onInit Function to retrieve the information.
Let’s state what the variables are:

For most developers, the idea of obtaining the UI elements is still unclear. So let’s get the fog cleared.
We do the following actions to link the data to the UI Elements:
- 1) Using its ID, obtain the UI Element
- 2) As soon as the UI element is ready, we create a standard JSON model—that is, just a model with data in JSON format.
- 3) After that, the data is created and stored in an array or data structure.
- 4) The data is then bound into the Jsonmodel.
- 5) Lastly, we tie the JSON model to the UI Element that was obtained at the initial step.
Assuming that the idea is obvious, let’s call the Odata Read Operation:

In this case, we read the FileSysSet entity set. After receiving a success result, we take the following actions:
1) We traced a for loop since we don’t know how many rows of file systems our Odata will produce, only the whole length of the Odata results.
2) We have generated an array with two elements—file and freespace—and filled it with the value corresponding to each index of the result within the loop. (The metadata contains the exact field name.)
3) We are pushing the data into the previously established blank array, “File,” for each iteration.
4) We set the title’s value in the results variable as we also need to set it dynamically.
5) Once the loop has been traced in accordance with the previously described notion, we set the data in the jsonModel and subsequently the jsonModel in the corresponding Micro chart and Tile.
Now that the controller is finished, let’s return to the View.

I’ve added something to the Microchart’s data section: the title and value are bound to the array FileData’s file and freespace properties, and the data is binded to the path FileData, a JSONModel that was produced dynamically in the controller.
In a similar vein, the variable result is bound to the title of the Generic Tile.heading.
Keeping our coding straightforward, let’s examine the result.
Excuse me, nothing arrived. What went wrong?

We did not include the microchart library.
Lesson: Since UI5 has libraries for everything interesting, let’s include xmlns:mc=”sap.suite.ui.microchart” in the View and see what happens. Whoa, the files that have less than 70 (customizable number) free space show up on the tile as a comparative chart.

Let’s adjust the table’s specific free space value and then reevaluate the user interface.

Whoa! The Files are too dynamic and the Title has been altered!

The intended result has arrived! Moreover, we can add even more dynamic elements by hosting press conferences for every microchart row!
The needed functionality will be available as soon as you click on each row.
you may be interested in this blog here
Salesforce Roadmap to Success: Mapping Out Your Training Journey
Empowering Your ABAP ALV with Integrated Data Access (IDA) on HANA:…